New challenges for a booming Bristol
What does an ever bigger population mean for democracy in our city?
Design: Woody
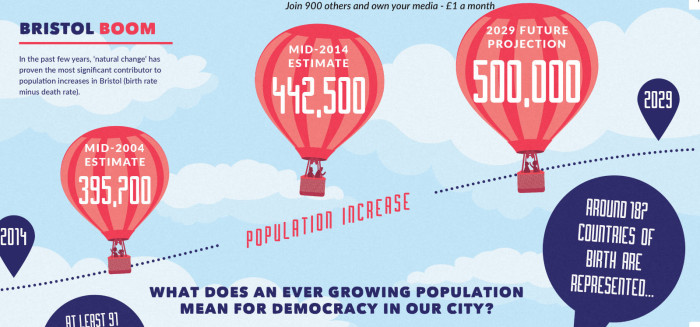
Bristol’s population is projected to have surpassed half a million by 2029, growing at a faster rate than the rest of England. With a changing population, both in size and nature, what implications might this have for democracy, participation and cohesion in the city?
Bristol is one of the UK’s ‘Core Cities’ and the largest city in the South West. During the 90s, Bristol’s population was declining due to out-migration of residents. But with population increases between 2004 and 2014, the city’s growth rate has outpaced that of England and Wales. A combination of increased births, decreasing deaths and net migration* were the main contributing factors over the decade. International net migration has fallen significantly from its peak in 2004, while internal net migration (movement of people from within the UK) is increasing, compared with negative figures for most of the decade to 2010.
What, if anything, does this mean for democracy and participation in our fair city? As a whole, the South West achieved the highest level of voter turnout of all English regions in the 2015 General Election; over 3% more than the national average of 66.2%. While this is positive, polling organisation, Ipsos Mori, has found that, nationally, there are low turnouts of young people, working class voters, private renters and Black and Minority Ethnic (BME) communities. Startlingly, those over 65 are considered almost twice as likely to vote as those aged 18-24.
More than a quarter of Bristolians are renters, 16% are BME and while Bristol has an ageing population, it is home to more residents under the age of 16 than those of pensionable age. What will this mean for electoral dynamics in our city, now and in years to come?
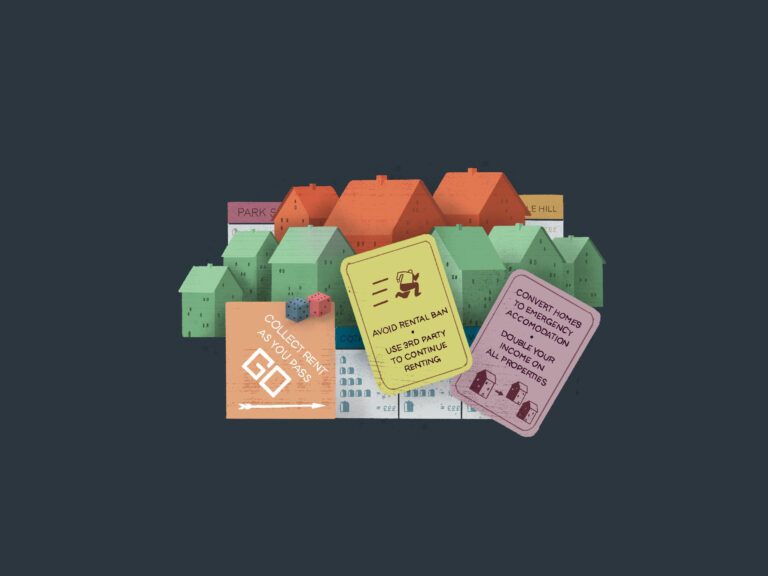
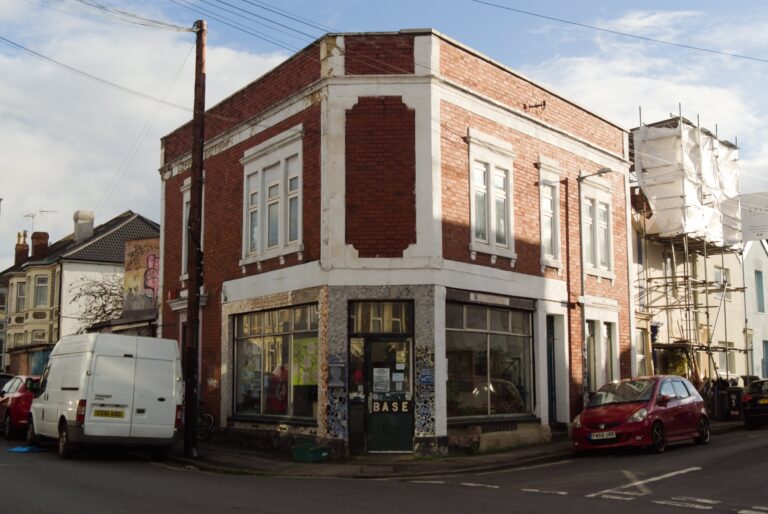
These population characteristics are of particular relevance in the inner city and inner east areas of Bristol. Working class and ethnically diverse areas such as Lawrence Hill, Ashley, Easton, Eastville and Cabot wards have experienced the greatest changes over the recent decade. Considering that population change is unevenly spread within Bristol’s wards, particular areas will face increased pressure from housing needs and gentrification.
With more people and increasing pressure on public services from austerity, the challenge will be to press for political processes that are engaging, democratic and responsive for Bristolians – all half a million by 2029!
What do you think? #boomingbristol

Getting on, but ageing well
One in five people in Bristol is under 16 (though Lawrence Hill has a younger average at one in four).
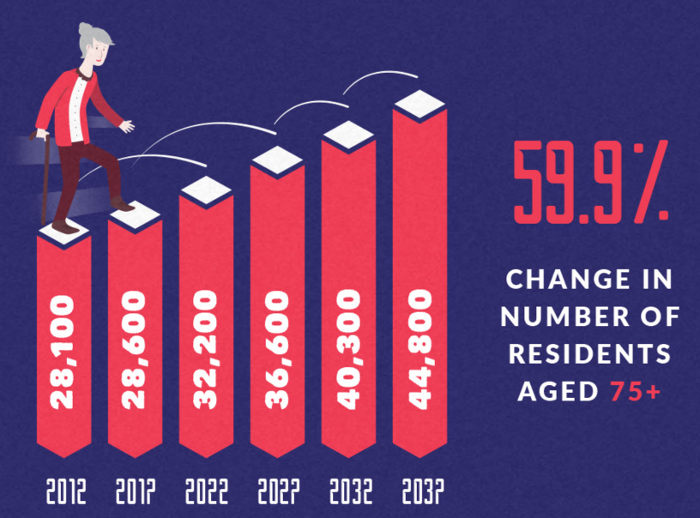
All age groups are projected to increase between 2012 to 2037, particularly young people, those in their thirties and older people. The greatest increase in any one age group in this period will be for those aged over 75.
Diverse Bristol, Różnorodny Bristol, متنوع Bristol
Bristol is a diverse, vibrant and multicultural city. According to the recent ‘Quality of Life Survey’, 62% of residents feel they belong to their neighbourhood and 63% of residents feel that people from different backgrounds get on well in Bristol. The proportion of non-White British residents increased from 12% to 22% between 2001 and 2014.
At least 91 languages are spoken in Bristol….
…around 187 countries of birth represented…
…and at least 45 religions practised!
Bristol bound
Since 2001 onwards, Bristol has, on average, attracted more people each year than have been leaving the city. After 2018/19, it’s predicted that more people will leave Bristol each year than will move here. International migration to the city peaked in 2004.

Data
Figures have been selected for a number of population characteristics considered to be of relevance to voting participation (based on Ipsos Mori analysis of non-voter demographics) and other elements of democracy in the city. Findings are drawn from the ONS mid-2014 population estimates. These figures are at a Local Authority Level, unless otherwise stated.
Summary
Data is taken from the following sources:
- 2011 Census Data
- ONS mid-2014 population estimates
- The Population of Bristol, October 2015
- The 2015 General Election: Aspects of Participation and Administration
- Bristol Quality of Life Survey
- Migrant Observatory