Seeing through the fog: Air pollution facts
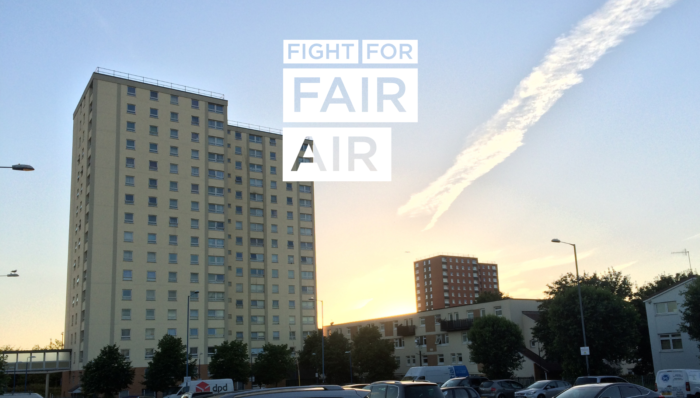

Key facts and figures on what’s in our air, where it comes from, and why we should worry.
There’s a growing awareness that air pollution damages our health and that as a city we need to take action. But what’s the science behind this? What are the effects on our health? How bad is the problem in Bristol and which areas are worse affected? Get clued up on air pollution.
What are the key pollutants?
Nitrogen Dioxide
What is it?
A gas
Where does it come from?
Road vehicles, and also cooking, heating or power generation
Where does Bristol’s NO2 come from?
Over 80% comes from local traffic sources, over 96% of vehicle NO2 emissions come from diesel vehicles
To fix this, we need less traffic on the roads, but…
-
The numbers of cars and vans on Bristol’s roads have tripled in the last 40 years
-
Bristol is one of the most dangerous cities to cycle in, with nearly twice the average number of accidents recorded in 2017
-
A 2017 study ranked Bristol as the worst city to travel within out of 33 cities
-
Congestion can mean buses on certain routes have an average speed of just 6mph
-
Only 1 in 11 people commuting in the West of England travel by bus
-
Meanwhile, 2 in 3 commutes are by car, and of those, 2 in 5 commutes are less than 2km
Particulate matter
What is it?
Small particles – ‘particulate matter’ – in the air, containing a variety of components
The numbers in PM10 and PM2.5 refer to the size of the particulate matter in micrometers. PM2.5, the smallest, is more damaging to human health as it can pass into the body, through the lungs to the bloodstream
Where does it come from?
Road traffic emissions, particularly from diesel vehicles. It is also emitted from industrial combustion plants and public power generation and commercial and residential fuel burning, such as the use of wood burning stoves
-
New evidence shows domestic fuel burning, for example from woodburners, contributes 38% of PM2.5 emissions nationally
-
Using a woodburning stove, even the most modern and ‘clean’, creates the same PM emissions per hour as 18 diesel cares or 6 lorries.
-
There is no safe level of exposure to PM
What are the health impacts?
Research is frequently finding new evidence of air pollution’s impact on our health, such as recent reports on how air pollution may increase the risk of miscarriage or depression. Here are a few of the most common impacts.

Lung Function:
Children – Can stunt lung function growth
Adults – Can make lung function decline faster / Exacerbates respiratory conditions like COPD and bronchitis
Eyes, nose and throat:
Irritation and breathing problems
Neurodevelopment and cognition:
Evidence suggests links between exposure to air pollution and small cognitive deficits in childhood, and accelerated cognitive decline in adulthood
Asthma:
Air pollution can make asthma symptoms worse and can cause onset asthma in children and adults
Cardiovascular (heart):
Exacerbates heart disease, heart attacks, heart failure and strokes
Cancer:
Strong evidence shows that outdoor air pollution causes cancer
Diabetes:
New evidence suggests there is a link between air pollution and type-2 diabetes
Pregnancy:
Low birth weights
Who is most affected?
Lawrence Hill & Central Wards
Hengrove & Whitchurch Park
Percentage of deaths attributable to air pollution differ by ward. Air pollution impacts most on vulnerable groups – children and older people, and those with pre-existing conditions. Air quality is often worse in deprived and central areas – where rates of car ownership are low.
Air pollution impacts most on vulnerable groups – children and older people, and those with pre-existing conditions. Air quality is often worse in deprived and central areas – where rates of car ownership are low.
How does Bristol compare?
Bristol
per 100,000
National average
per 100,000
In Bristol, early death rates from respiratory disease are significantly higher than the national average. But it has the second lowest rate compared to the eight other ‘core cities’.
How bad is Bristol’s problem?
People (approx)
Schools
Thousands of people and dozens of schools reside in Bristol’s Air Quality Management Area, which is exposed to dangerous, and illegal, levels of NO2
Total impact
Number of deaths per year attributable to air pollution
Percentage of deaths each year
Sources: Environmental Protection UK, Bristol City Council 2018 Annual Air Quality Status Report, Royal College of Physicians,
2016. Evidence Review, ClairCity, Clean Air for Bristol, Health Impact of Air pollution in Bristol, Bristol City Council,
Travelwest Draft Joint Local Transport Plan 4, BCC Joint Strategic Needs Assessment 2018


Report a comment. Comments are moderated according to our Comment Policy.
Can you extrapolate on the “Who is most affected?” figures, please? Does it imply that the worst 10% of pollution is in Lawrence Hill or that 10% of vulnerable groups live there? Something else? This is where I live?
These are good figures, but I think it’s unclear what they mean. For example, I live in Lawrence Hill and am among the 10% most affected, but 10% of what? What exactly is the percentage reflecting?
*This is where I live.
Hi Charles, you have pointed out a mistake that we didn’t notice before printing, whoops that’s embarrassing, I’ll get it changed tomorrow! The percentages refer to the number of deaths in the ward that are attributable to air pollution, from a report commissioned from the council here: https://www.bristol.gov.uk/documents/20182/32675/Health+Impacts+of+Air+Pollution+in+Bristol+February+2017.pdf/4df2fce5-e2fc-4c22-b5c7-5e7a5ae56701 (pg28)
Grim reading, I know
Hi Lorna, “18 diesel cares or 6 lorries”, I think you mean cars
Bristol does indeed need to do a lot about its transport and air pollution. I do find it ironic that it was the “Green Capital” a few years ago, as in certain respects Bristol is one of the worst of the large cities of England.
However, while I am a cyclist and a fan of more cycling infrastructure, I am not sure that that is “key” to Bristol’s air pollution or transport issues. Bristol also needs to reopen its suburban railway network (closed in 1960s), electrify it, and probably also install trams or at least trolley or fully electric buses. Bristol needs to rid its centre of most of the multi story car parks, and institute an inner area pollution charge zone as per London. Public transport fares need to be halved.
Living in the Lawrence Hill Ward I am aware of the air pollution from major roads in the area, both from dirt in my house, constant minor coughs and throat irritation. This is causing me to make plans to move.
I see that the Hengrove and Whitchurch ward is the 2nd worst affected ward. It does not make sense then to use, Whitchurch Lane, a residential road that goes right through the ward, as a ring road to carry even more diverted traffic to the area? Why is Bristol City Council even considering it. It is the wrong road for a ring road. It is so obvious!
1000’s of people who live in the area are against the idea of it and have grouped together to object via their Facebook group ‘SOUTH BRISTOL WRONG ROAD’. They also have a website. http://www.wrongroad.org.uk